

Looking to improve the performance of your SSAS solution? Dustin Ryan has you covered. In this post, he will discuss three best practices that you can follow to improve performance and management. Following these best practices will make a huge difference when dealing with large SSAS solutions.
Create Hierarchies with Attribute Relationships
In my opinion, creating natural hierarchies are the single most beneficial thing an SSAS developer can do to improve the performance and usability of a cube. There are several reasons correctly defined user hierarchies are beneficial, but here are a couple of the top reasons.
Increased Query Performance
 Creating attribute relationships between attributes that are included in a user defined hierarchy improve the performance of queries using these attributes for a couple different reasons. In this case, we’ll look at the Calendar hierarchy in the Adventure Works Date dimension. The Calendar hierarchy has five levels with the Calendar Year attribute at the top level and the Date attribute at the bottom level of the hierarchy. We can also see the following attribute relationships created to give SSAS an understanding of how the members of these attributes relate to one another. Once created, these relationships give SSAS the ability to understand that a given date member is related to a single month member, a given month member relates to a single quarter, and so on and so forth.

This also means that during processing, special indexes are created that map the relationships between each member of each level in the hierarchy. This means that before a query is written, SSAS also knows to which month, quarter, semester, and year each date aggregates. These indexes are only created if you correctly define the attribute relationships between the attributes in the hierarchy.
Improved User Experience
 User-defined hierarchies also improve the user’s experience with the dimension because the hierarchy provides a very natural way for the user to navigate through the data in the dimension. A user-defined hierarchy does two things for a user: 1) Using the hierarchy obviously presents the data to the user in an understandable and clear way. And 2) the hierarchy organizes the data based on your business requirements. This means that the user doesn’t have to think about how should these attributes be organized or labeled because you’ve done that for them. The user can focus on reading their reports, understanding the data, and making business decisions.
Partition Measure Groups to Separate Volatile and Static Data
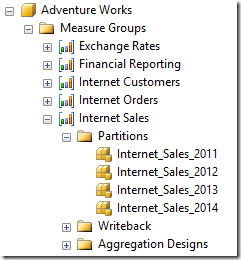
 Measure groups that are larger than (about) one million records should be separated into multiple partitions. There are several advantages to separating larger measure groups into multiple partitions.
Increased Processing Performance
Partitions in a measure group are processed in parallel. This means that a measure group containing three years worth of data separated into one partition for each month will process faster than a measure group with all three years worth of data in a single partition. Your processing strategy for each measure group may vary depending on the amount of data. For instance, a large telecommunication company may collect hundreds of millions of records per day, dictating a more complex and granular partitioning strategy.
Also, we should consider which partitions contain data that is changing vs. data that is now static. If our businesses will continually log transaction in the current month, we can partition our data by month effectively separating our volatile data from the static data. This means we only need to process one months worth of data in our cube to pick up the latest changes instead of having to processing the whole measure group.
Increased Query Performance
By partitioning our data at the month level, certain queries will also perform better. For instance, imagine a user queries our measure group searching for last month’s sales figures. Because we have partitioned our measure group with each month being loaded into a separate partition, this means that the entire measure group does not have to be scanned. Only the partition containing the data for the month in question needs to be queried.
Create Aggregations for Large Measure Groups
You can think of Aggregations as indexes for SSAS. Aggregations are used to help SSAS find the answer to a user’s query faster. Aggregations are typically used for measure groups that are large and take a considerable amount to query.
Improved Query Performance
Aggregations contain the data of a measure group at a summary level typically higher than the lowest level of data included in the measure group. Aggregations are populated during the processing phase of the partition. You can think of Aggregations as exactly the same as the lowest level of the measure group just at a summary level. This means that when SSAS receives a query that can be answered using an Aggregation, SSAS does not have to spend the additional time required to retrieve the measure group data from the lowest level and roll up the data to the requested level because the Aggregation design already contains the data at the desired level.
Beware Too Many Aggregations
Because Aggregations are built during the processing phase, this means that for every aggregation you define more time is required to build the aggregations. This also means that it is especially important to only build useful aggregations that are necessary to improve performance. By creating aggregations that are not often used, you can degrade query performance and increase processing time with little to no benefit. Like indexes on a SQL Server table, too many aggregations or the wrong aggregations can actually hurt performance, so make sure you test, test, and then test to ensure your aggregations are helping your query performance.
I hope you have found this information useful. By following these three best practices, I really believe you’ll see a generous improvement in the performance of your SSAS cubes.
Are you in need of SSAS training? For a limited time you can receive 20% off your SSAS virtual training purchase using the promo code SummerSale. Take a look at our online Analysis Services courses taught by Dustin and other industry experts:


-1.png)
Leave a comment