This post reviews some of the tips and techniques that I covered in my webinar Performance Techniques for Power BI Data Models. To save blog space I have highlighted the first 5 tips from the presentation. There are more tips and techniques, along with expanded explanations and references in the presentation slides.
The Problem
Power BI is fast, and the columnar data store is forgiving of large data sets. However, if you find that your Power BI desktop solution is slowing down or that the refresh of a published BI data set takes a very long time review these tips to see if they can help you streamline your data model and reports.
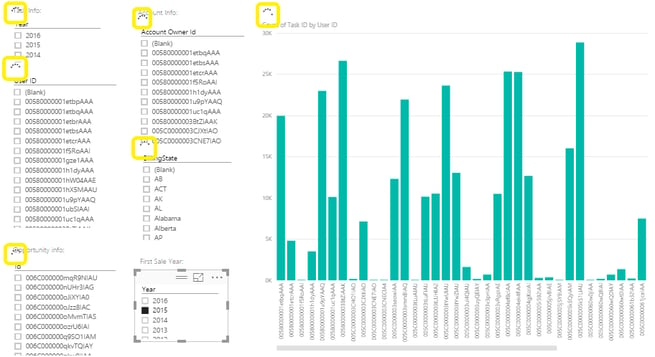
My example data for this talk is a customized Tasks table from Salesforce. This real life data table comes from a client and is sanitized for confidentiality. The example has over 382,000 rows which isn’t a large table for Power BI. When the data is loaded into Power BI, the stored file size on disk balloons to over 500MB. In memory this data set occupies over 1GB.
The unwieldy Power BI solution became very slow as I updated calculations. Symptoms of this were:
- Calculation edits were slow
- Slicers on reports slowed down
- Refresh of data took a long time to load and process the Task table
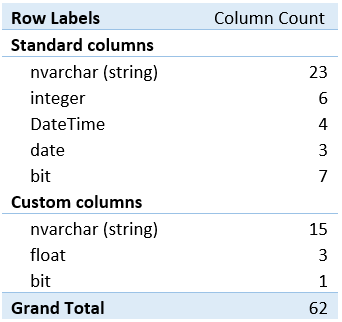
The 62 columns in the Tasks table breakdown like this:

The Tips
What makes this table unwieldy for the columnar data store is partially the string columns, 13 of them are over 200 characters long. That field format is a likely indicator that text values are entered by typing and therefore have many different values, probably in almost every non-blank field.
Every tip listed here might not apply to your challenge. For more information about each tip, please review the slides from my presentation or view the recorded webinar here.
#1: Tall, narrow tables are faster*
Corollary to #1 Tip 1a: Remove any unused fields.
*The exception:
In the case of tables with 10’s of millions of rows, the 1M-row partitions or “Chunking” may interfere with efficient compression rates, please read this article for more information:
http://www.powerpivotpro.com/2012/03/powerpivot-compression-mysterious-ways/
As you can see from the data load timing table below, and from the image of comparison file sizes, once a few of the high cardinality (very unique) large fields were removed, the file size dropped and the data loaded much faster.
Tip #2: Integers are faster than strings
Comparing the final two entries in the file system image shows that over 1KB of disk storage was necessary to store the string ID fields that are unique on every row (very high cardinality). Since strings are stored in a hash table, they are effectively referenced twice, once for the hash value and once to fetch the string associated with that value. If the strings are highly unique this can cause an increase in memory requirements. Changing this to a predictable integer that is incremented for every row allows columnar storage to compress this column and the hash table reference is no longer necessary.
Tip #3: Slicers use multiple queries
I’m not saying that slicers are bad, they are great. For usability you want to keep unique values down in a slicer list and using them together is an excellent way to find and compare data.
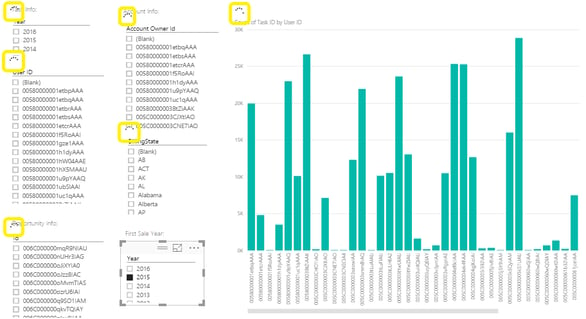
Do use them with some caution. Be aware that if you have many large slicers on one report they may start to slow performance as each slicer selection causes full scans of each other slicer and the visualizations on the page.

Many large slicers user with cross referencing may cause slow performance and wait times for users.
Tip #4: Understand DAX functions
Although I don’t show a statistic on this tip in this article, this can be very important if you are building your model in Power BI. Be careful about your DAX functions, and be wary of those like FILTER that cannot bulk scan the table but must test every row.
Tip #5: Remove unnecessary precision or split granularity values to reduce cardinality
Significantly reduce highly unique datetime values by splitting the date and time into separate columns.
Technique: Check your memory usage
Measure relative memory usage of each table and field using Kasper de Jonge’s Power Pivot Memory Usage tool in Excel.
Bonus Tool
Power Pivot Utilities combines DAX Studio, the Excel Memory Usage Tool and other tools together into a single add-in ribbon. It was recommended to me in a comment by Donald Parish on the first presentation of this talk. This tool has been built by Bertrand d’Arbonneau and is published on SQLBI.
The Solution
As I followed the tips documented below, the disk file size quickly dropped:

As the file size dropped, the behavior of my solution improved quickly. It is difficult to demonstrate this in a blog post, but the time to load the Tasks table is one measure that fell fast, as soon as I dropped a few very large text columns and continued to improve as I applied other tips.

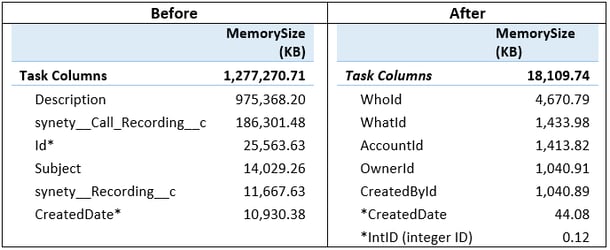
The proof is in-memory size. The tables below are a few rows from Kasper de Jonge’s Power Pivot Memory Usage tool in Excel before and after all steps tips are applied. Notice that the top 5 memory using fields are now string reference ID’s to other Salesforce tables.

Overall we have reduced the disk size by 96% and the in-memory size by 99% without losing any capability to report relevant information about our Salesforce tasks.
|
Before (KB) |
After (KB) |
Reduction % |
|
|
on disk |
520,586 |
18,690 |
96% |
|
in memory |
1,277,271 |
18,110 |
99% |
Thank you to those who provided input and questions on the presentation last week. I have tried to incorporate your comments and answers to your questions to improve this post.For more in-depth explanation of these and other tips, along with references to the great articles that others have written on these topics, please review the attached slide deck.
Sign-up now and get instant access
ABOUT THE AUTHOR
Free Trial
On-demand learning
Most Recent
private training


-1.png)
Leave a comment