


**Information is current as of 5/21/2015**
Recently Azure SQL Database was added as a new connection to the Power BI Preview. Read the notes about how it can be used here. The things I found especially worth noting were:
- Every action sends a query back to the database. So you’re seeing the data real time from that database
- Dashboard tiles are automatically updated every 15 minutes. Meaning you don’t even have to schedule a refresh
- Q&A is not available with this direct connect to the live data :(
- The direct connection and refresh only works when building reports directly from PowerBI.com and does not work from the Power BI Designer
Keep in mind these things may change but that’s how it exists in preview now. I thought I’d give it a try and walk you through a quick example of getting connected to a Azure SQL Database that’s been made available free to the community.
Getting Connected
- If you haven’t already, you'll need to sign up for the Power BI preview at PowerBI.com
- Once you’re signed up, you can sign in at PowerBI.com to get started
- To create a refreshable data source from an Azure SQL Database, select "Get Data"

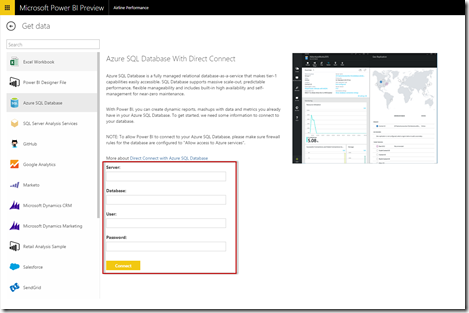
- Then select "Azure SQL Database" as your data source.

- If you don’t have any Azure SQL Databases but would like to still test this out, then you may use the one that SQLServerCentral.com has kindly provided with login details to the community for free here. This is the AdventureWorks database with several other supplemental tables added to it as well.
- Connect to your Azure SQL Database by providing the Server, Database,User and Password then click Connect.
- This will create a new Dataset to the AdvnetureWorks2012 Azure database and a new Dashboard (if you didn’t already have one selected) called Azure SQL Database.

- Select the dashboard and you will see a placeholder tile for the dataset.

- Click the placeholder to explore the data or click the dataset and it will launch the report designer where you can begin building a new report.
- If you’re using the sample provided by SQLServerCentral, then you may be a little overwhelmed with all the tables listed to for my demonstration. I used the Categories, Customers, Products and Order Details tables to produce a report that looks like this.

- Once you’ve built a report make sure to save it.
- Once the report is saved, you can pin a visualization to your dashboard by simply clicking the Pin to your dashboard button and it will appear on the dashboard.

- If you return to the dashboard, you will see any pinned items now appear there.

- These will also appear on mobile devices where Power BI is currently available.
To learn more about Power BI from Devin, follow him on Twitter or read more articles on his blog.

.png)


-1.png)
Leave a comment