


A Bit of Intro
If I recall correctly, I completed the first version of this data architecture diagram in 2012 when we used terms like "road map" and "blueprint" Back then, along with different terms, we were also using traditional SSIS, SSAS-MultiD and SSRS tools. Now we live in the world of cloud everything, although we are still driving from SRC-to-DST (source to destination). I'm up for whatever terminology you want to use, but can we agree that we are surely on a different highway? For my classical BI Blueprint, click here, but to see an Azure road map for BI, please take a look below.
Disclaimer: I create a different diagram for every engagement, so think of this as a suggestion, not a mold.
Azure Data Architecture BI Talking Points:
BI Advice from the University of Hard Knocks:
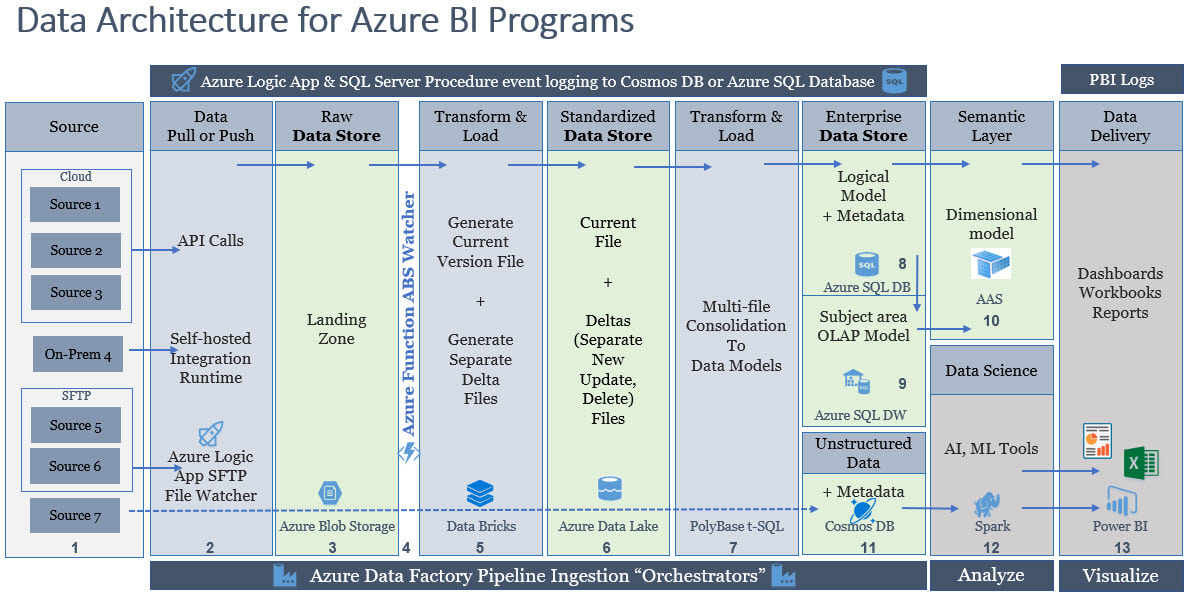
Conclusion of the Matter: I am not explaining every column in the data architecture because the columns in the above diagram are not applicable to everyone. For example, almost everyone needs a semantic layer, but not everyone needs a logical data store for operational reporting. Column #5 can be done in Spark as well as Data Bricks; instead of my telling you what the best solution is, let's talk about it. For every column there is a good, better and best solution, and good heavens (!) not everyone needs a thirteen point data architecture! All things in moderation, right?
I am asking, if you have taken the time to read this, please start planning before you start building! Opening Power BI and mashing up data from three different sources is generally not a scalable solution. Get started with a data architecture diagram and build a better BI house!
- Start thinking "event", "file based ingestion", "streaming" and "near real time" replacing the former batch mode thought process.
- Adopt an "I can, but I won't" methodology as you reach for optimal Azure solutions. Identify the intended purpose for each Azure tool and stick with it. There shouldn't be data transforms happening in every column, and stand alone semantic layers growing in every Power BI report.
- Simplistic repeatability is the key to successful CI/CD (continuous integration, continuous delivery). Data enters ABS (Azure Blob Storage) in different ways, but all data moves through the remainder of the ingestion pipeline in a uniform process.
- Consider hiring a former web developer. More and more Azure offerings are coming with a GUI, but many will always require .NET, R, Python, Spark, PySpark, and JSON developer skills (just to name a few). You will need these skills for columns #2 and #5 above.
- Be prepared to replace SSIS functionality with ADFv2, v3, v4 (eventually), and Sql Server User Stored Procedures. I think of Azure Data Factory v2 as an "orchestrator" right now, but I hear the next version will include data transformation capabilities.
- Build current and future state data architectures. This foresight helps to ensure a solid foundation as you build your BI house in increments. It is generally a misstep to plan a Taj Madashboard, that needs information for every system in your company, as your first deliverable.
- Model your data stores around reporting and security requirements, not what is easiest for data ingestion.
- Start small and scale up with all your Azure resources. This is the premise of an Azure cost-effective solution.
BI Advice from the University of Hard Knocks:
- Every decision point should be what is best for reporting and analytics, not data transform and load. Please see my BI Wheel for success. The wheel spokes change with Azure, but the theory does not.
- Require uniformity and avoid one-off creative solutions. Make your first exception on the last day of the 5th year after you have gone to production.
- Don't complicate your data architecture just because it's new, challenging and fun. Always produce a finished product that can be handed off to an entry-level developer. More than one person in the BI team should be able to service each part of the architecture.
- Don't design your data architecture around 10% of your user base i.e. the number of people who may hold a master's degree in statistics at your company.
- Design a BI solution without end-user input, and they will not come. Attitude is 50% of the success of your BI solution. Give strategic company users an investment in the project, and then they will adopt it.
Conclusion of the Matter: I am not explaining every column in the data architecture because the columns in the above diagram are not applicable to everyone. For example, almost everyone needs a semantic layer, but not everyone needs a logical data store for operational reporting. Column #5 can be done in Spark as well as Data Bricks; instead of my telling you what the best solution is, let's talk about it. For every column there is a good, better and best solution, and good heavens (!) not everyone needs a thirteen point data architecture! All things in moderation, right?
I am asking, if you have taken the time to read this, please start planning before you start building! Opening Power BI and mashing up data from three different sources is generally not a scalable solution. Get started with a data architecture diagram and build a better BI house!


-1.png)
Leave a comment