


Allison Gonzalez, a Microsoft Certified Trainer, provides a comprehensive overview of Power BI visuals in her video series on report building. In this summary, we'll explore the basics of Power BI visuals and the customization options available for slicers, column and bar charts, line charts, and scatter charts.
Power BI Report – DESIGN SERIES
Slicers
Allison begins by explaining the importance of choosing the right visuals for your data. She focuses on slicers, a common tool for filtering data in Power BI. Slicers allow users to select specific values to filter their data. In the video, she demonstrates how to add a slicer to a report and discusses different slicer types: vertical list, tile, and dropdown. She also covers options for customizing slicers, including changing button colors, adding borders, and adjusting text settings.
Column and Bar Charts
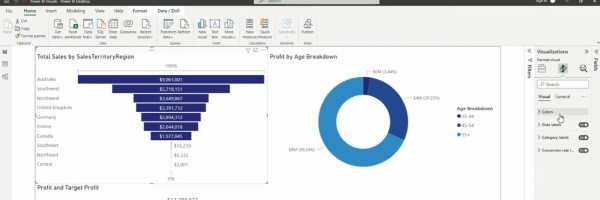
The next topic is column and bar charts. Allison explains that these two types of charts serve the same purpose but may be chosen based on available space (vertical or horizontal). She demonstrates how to create both stacked and clustered column charts, emphasizing that clustered charts are generally more readable when dealing with multiple data fields. She also highlights customization options like adjusting data labels, changing font sizes, and controlling the legend's appearance.
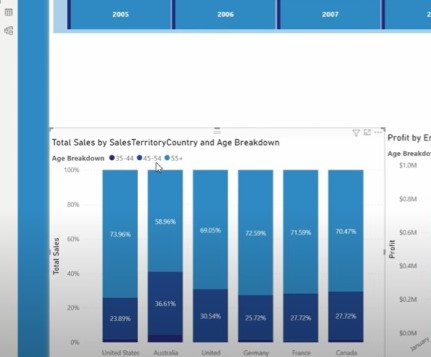
Allison introduces the concept of 100% stacked column charts, which display data as percentages of a whole, making them suitable for comparing proportions within categories. She emphasizes the importance of keeping visuals clear by optimizing titles and labels and discusses background and border options for these charts.
Line Charts
Moving on to line charts, Allison introduces area charts and line charts as two options for visualizing data trends over time. Area charts fill the space below the lines, making it easier to perceive data trends. She covers the basics of setting up line charts with X and Y axes, legends, and data labels. Customization options for line charts include adding constant lines and adjusting their appearance to highlight specific data points or trends.
Scatter Charts
Allison's video also includes scatter charts, which are useful for visualizing data points in two dimensions. She explains the key components of scatter charts, such as X and Y axes, legend fields, and size controls. She introduces the play axis, which animates data points over time, and discusses its relevance for showing data changes over a period. Scatter charts allow users to interact with individual data points, making them a powerful tool for data exploration and analysis.
In summary, Allison Gonzalez's video provides a thorough overview of Power BI visuals, including slicers, column and bar charts, line charts, and scatter charts. She emphasizes the importance of choosing the right visual for your data and demonstrates customization options for each type of visual. Her guidance helps users create effective and informative reports in Power BI.


-1.png)
Leave a comment